Waves of Migration
“Birds arrive in waves of migration shaped by their diet, flying distance, and the season. You can see these waves in the 10 most frequently banded species throughout the spring.”
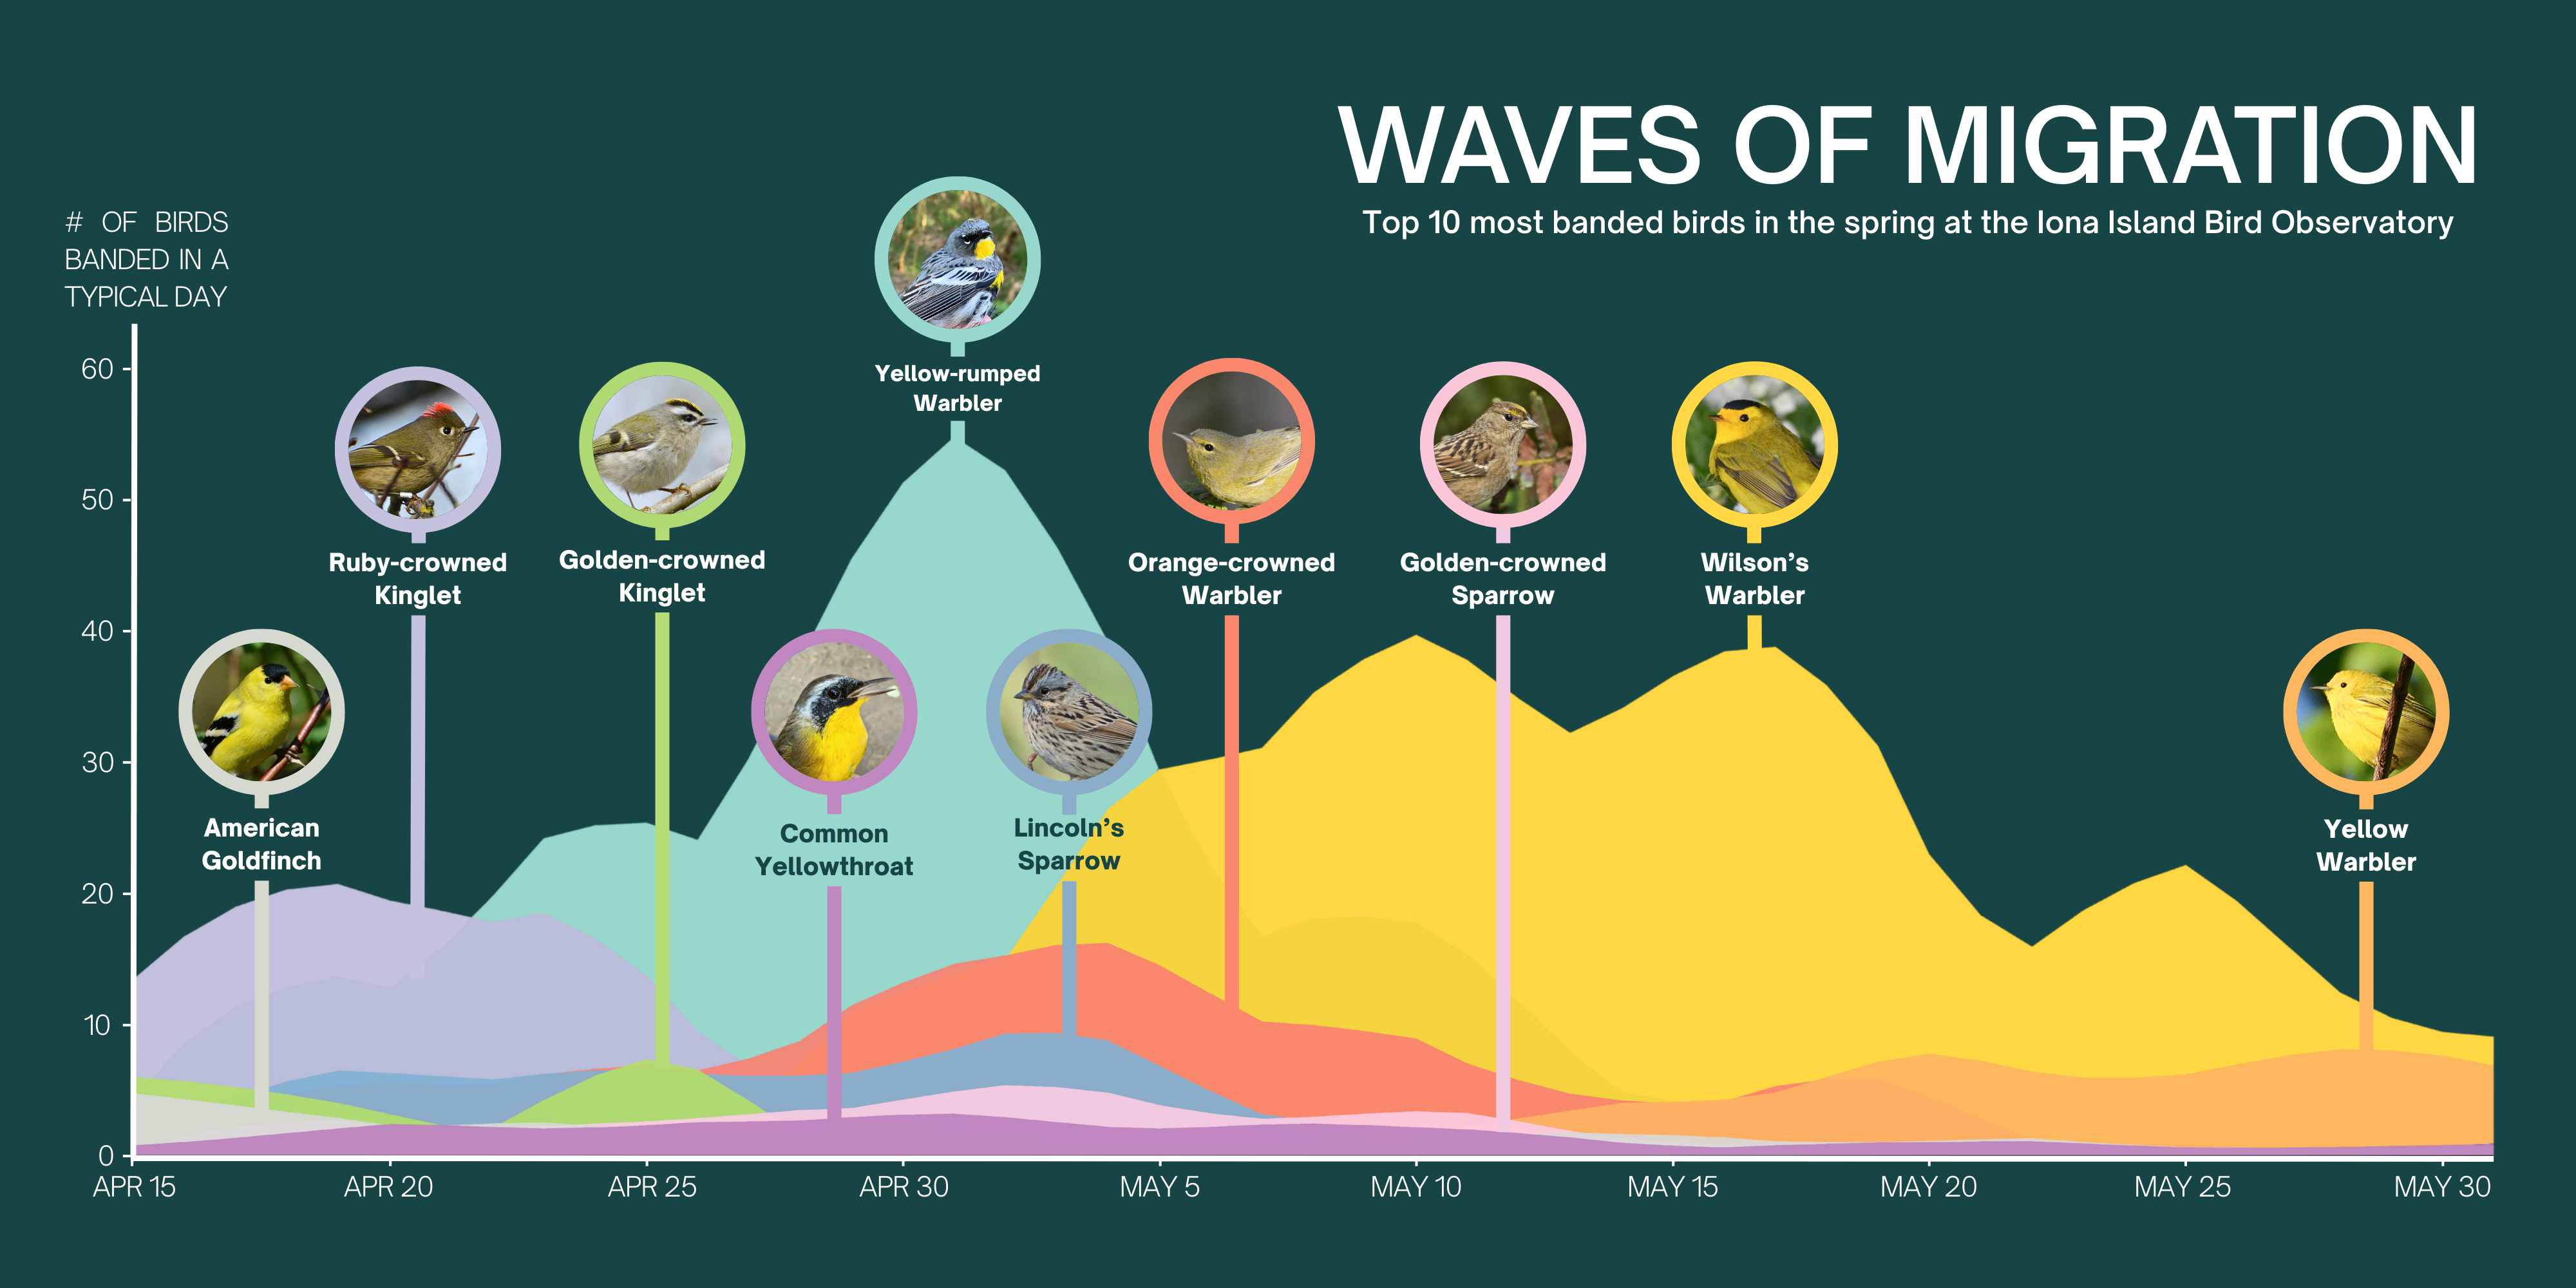
Rather than a strict sequence, spring migration is a layered story of strategies, characters, and histories. Different species arrive at the Iona Island Bird Observatory (IIBO) at different times according to their needs. It’s a balance between waiting for warm weather, food, and getting started on breeding.
Among the first to arrive are Kinglets — tiny birds that are incredibly cold-tolerant and can eat insects hidden in tree needles and bark. Birds that migrate short distances arrive next, while long-distance insect-eaters from Central and South America tend to peak later.
This analysis is part of the Stories in Flight project, intended to help people connect with the rhythms around Iona Island (xʷəyeyət in hən̓q̓əmin̓əm̓), tease what we might expect during the banding season, and highlight patterns in bird migration. It was inspired by Black Swamp Bird Observatory’s Spring Migration Wave Theory and the many times the IIBO team has said, “We’re in the kinglet wave,” or “The Yellow Warblers are starting to arrive!”
Over the spring monitoring seasons from 2015 to 2025, tens of thousands of birds were banded. These are the banding totals for the top 10 species in spring:
| Species | Code | # Banded |
| Wilson’s Warbler | WIWA | 4,479 |
| Yellow-rumped Warbler | YRWA | 3,632 |
| Orange-crowned Warbler | OCWA | 1,441 |
| Ruby-crowned Kinglet | RCKI | 1,060 |
| Lincoln Sparrow | LISP | 731 |
| Yellow Warbler | YEWA | 726 |
| Golden-crowned Sparrow | GCSP | 465 |
| Common Yellowthroat | COYE | 396 |
| American Goldfinch | AMGO | 377 |
| Golden-crowned Kinglet | GCKI | 316 |
Case of the Wilson’s Warbler
Wilson’s Warblers are an interesting example of all the stories that can be hidden within a wave of migration.
They are the most frequently banded bird in the spring at the IIBO, and their presence stretches well over half of the spring monitoring season. This pattern likely reflects their leapfrog migration strategy, where birds from more southerly breeding populations pass through stopover sites earlier than those from more northerly populations, “leapfrogging” over them in space and time. For Wilson’s Warblers, migration timing also differs between males and females, who travel separately.
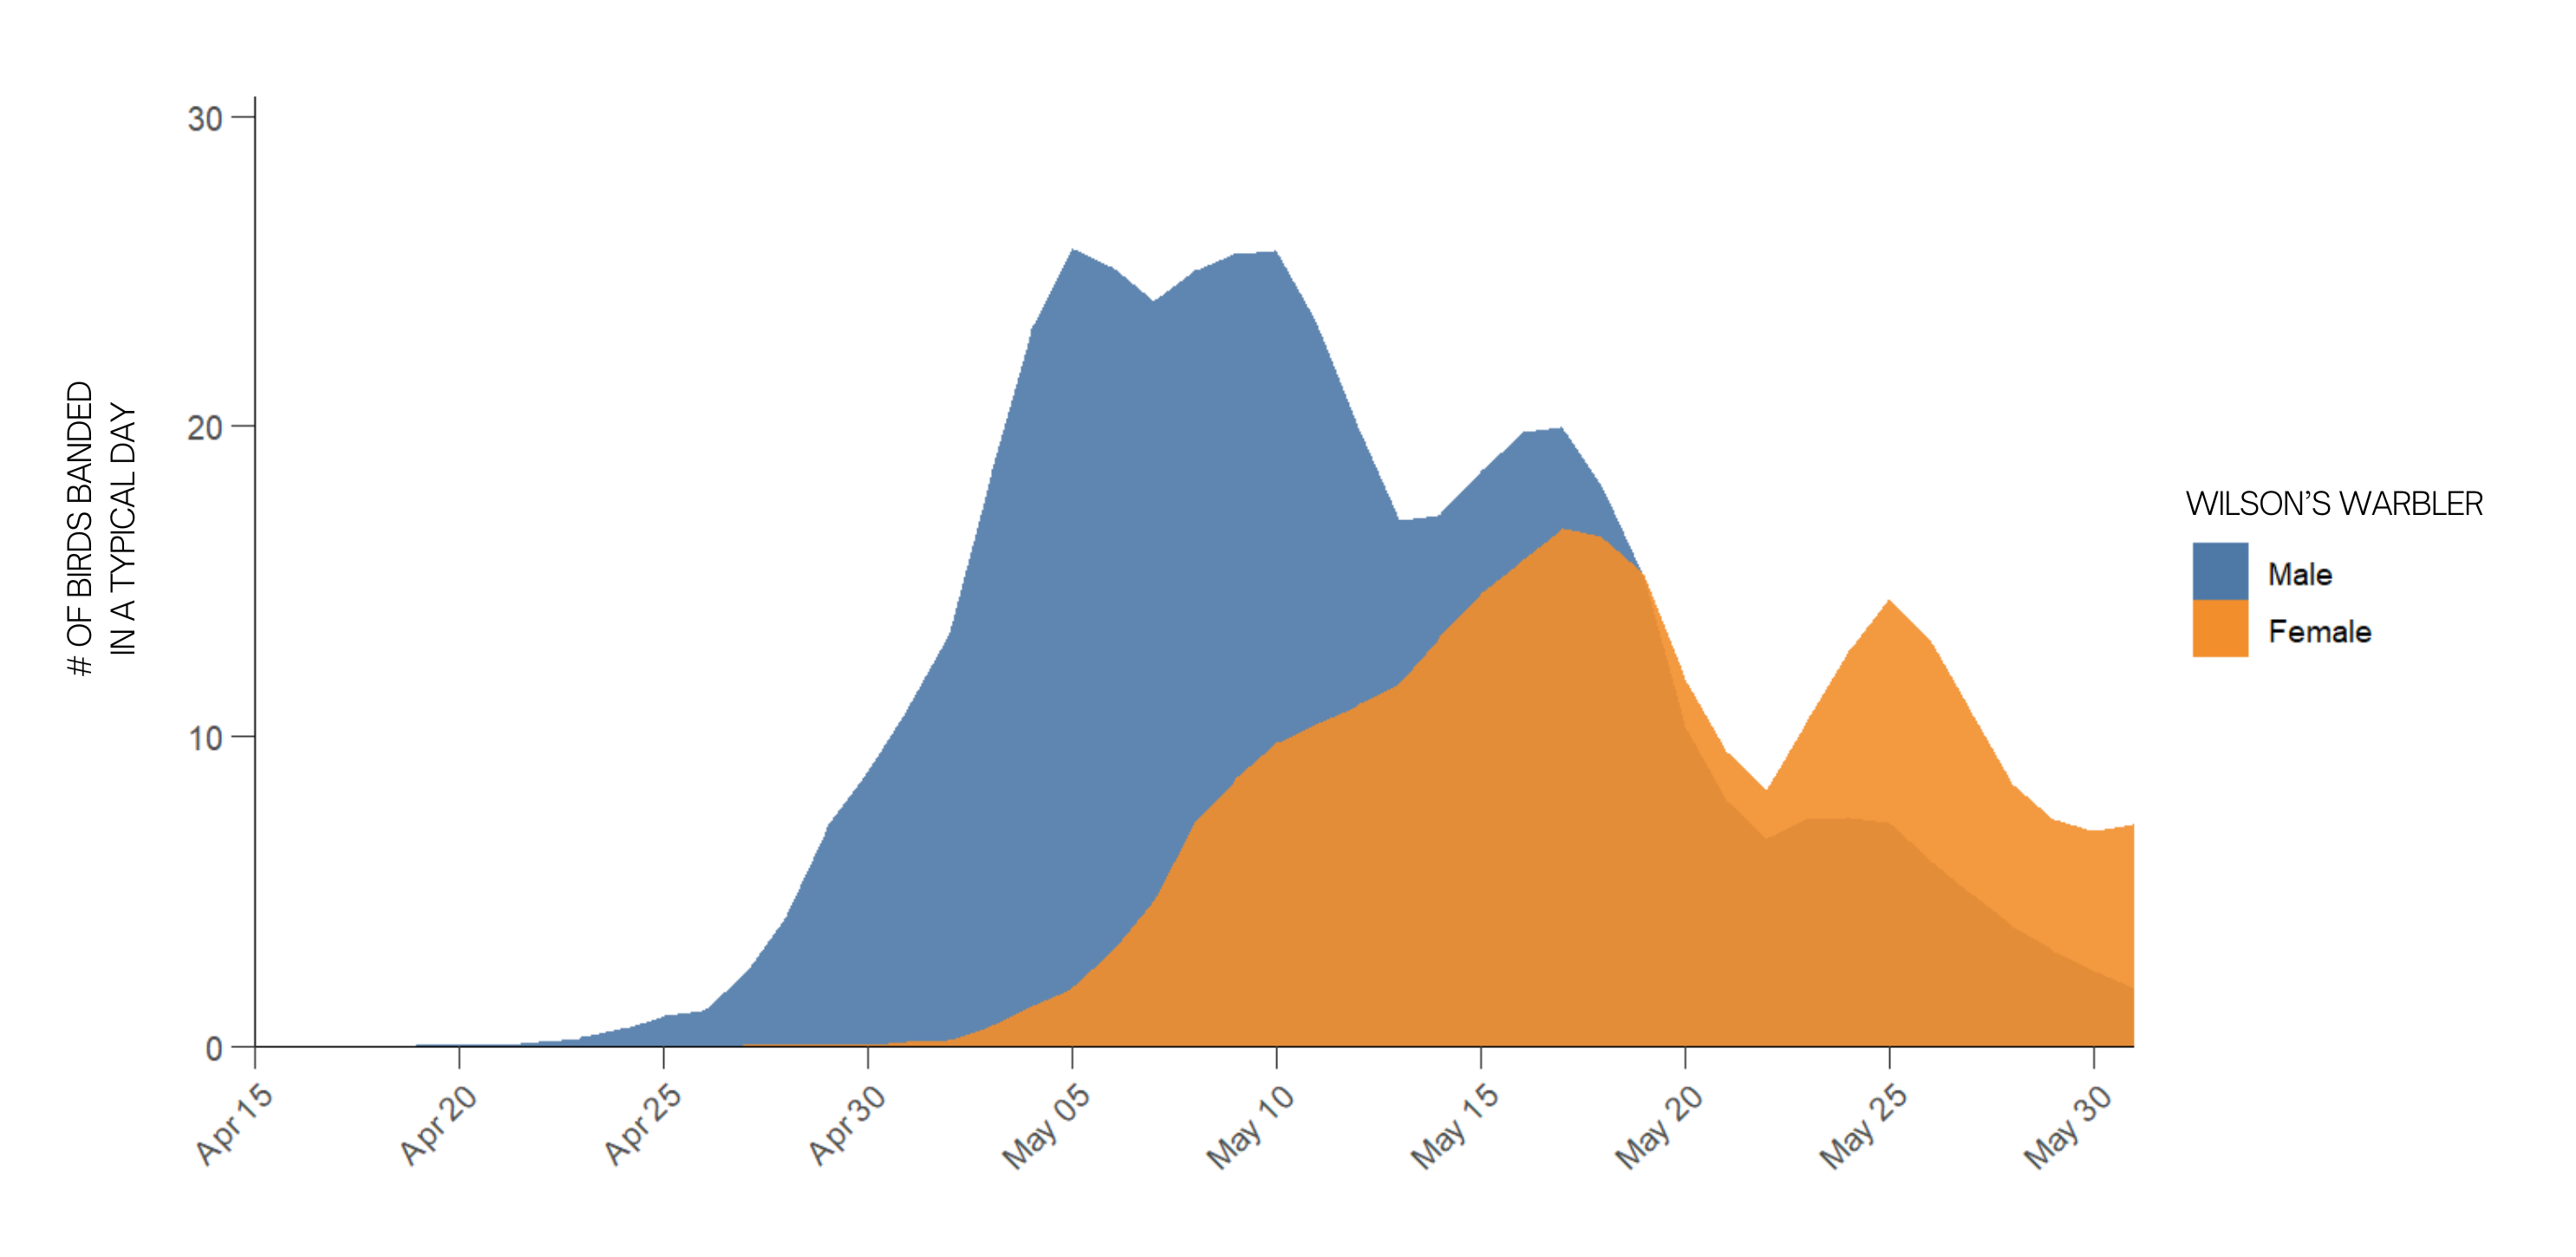
Wilson’s Warblers arrive at Iona in two pulses, with males arriving before the females.
Many studies are also finding that climate change and shifting timing in resources are altering migration patterns, often resulting in mismatches between bird arrival and peak food availability. Although not analyzed for this project, it’s also likely that the waves are influenced by the age of the birds as well.
A different rhythm in fall
In the fall, birds are no longer racing to breed and take advantage of increasing food in the north. Instead, adults and newly fledged (independent) young move south on instinct as temperatures dip, days shorten, and food dwindles.
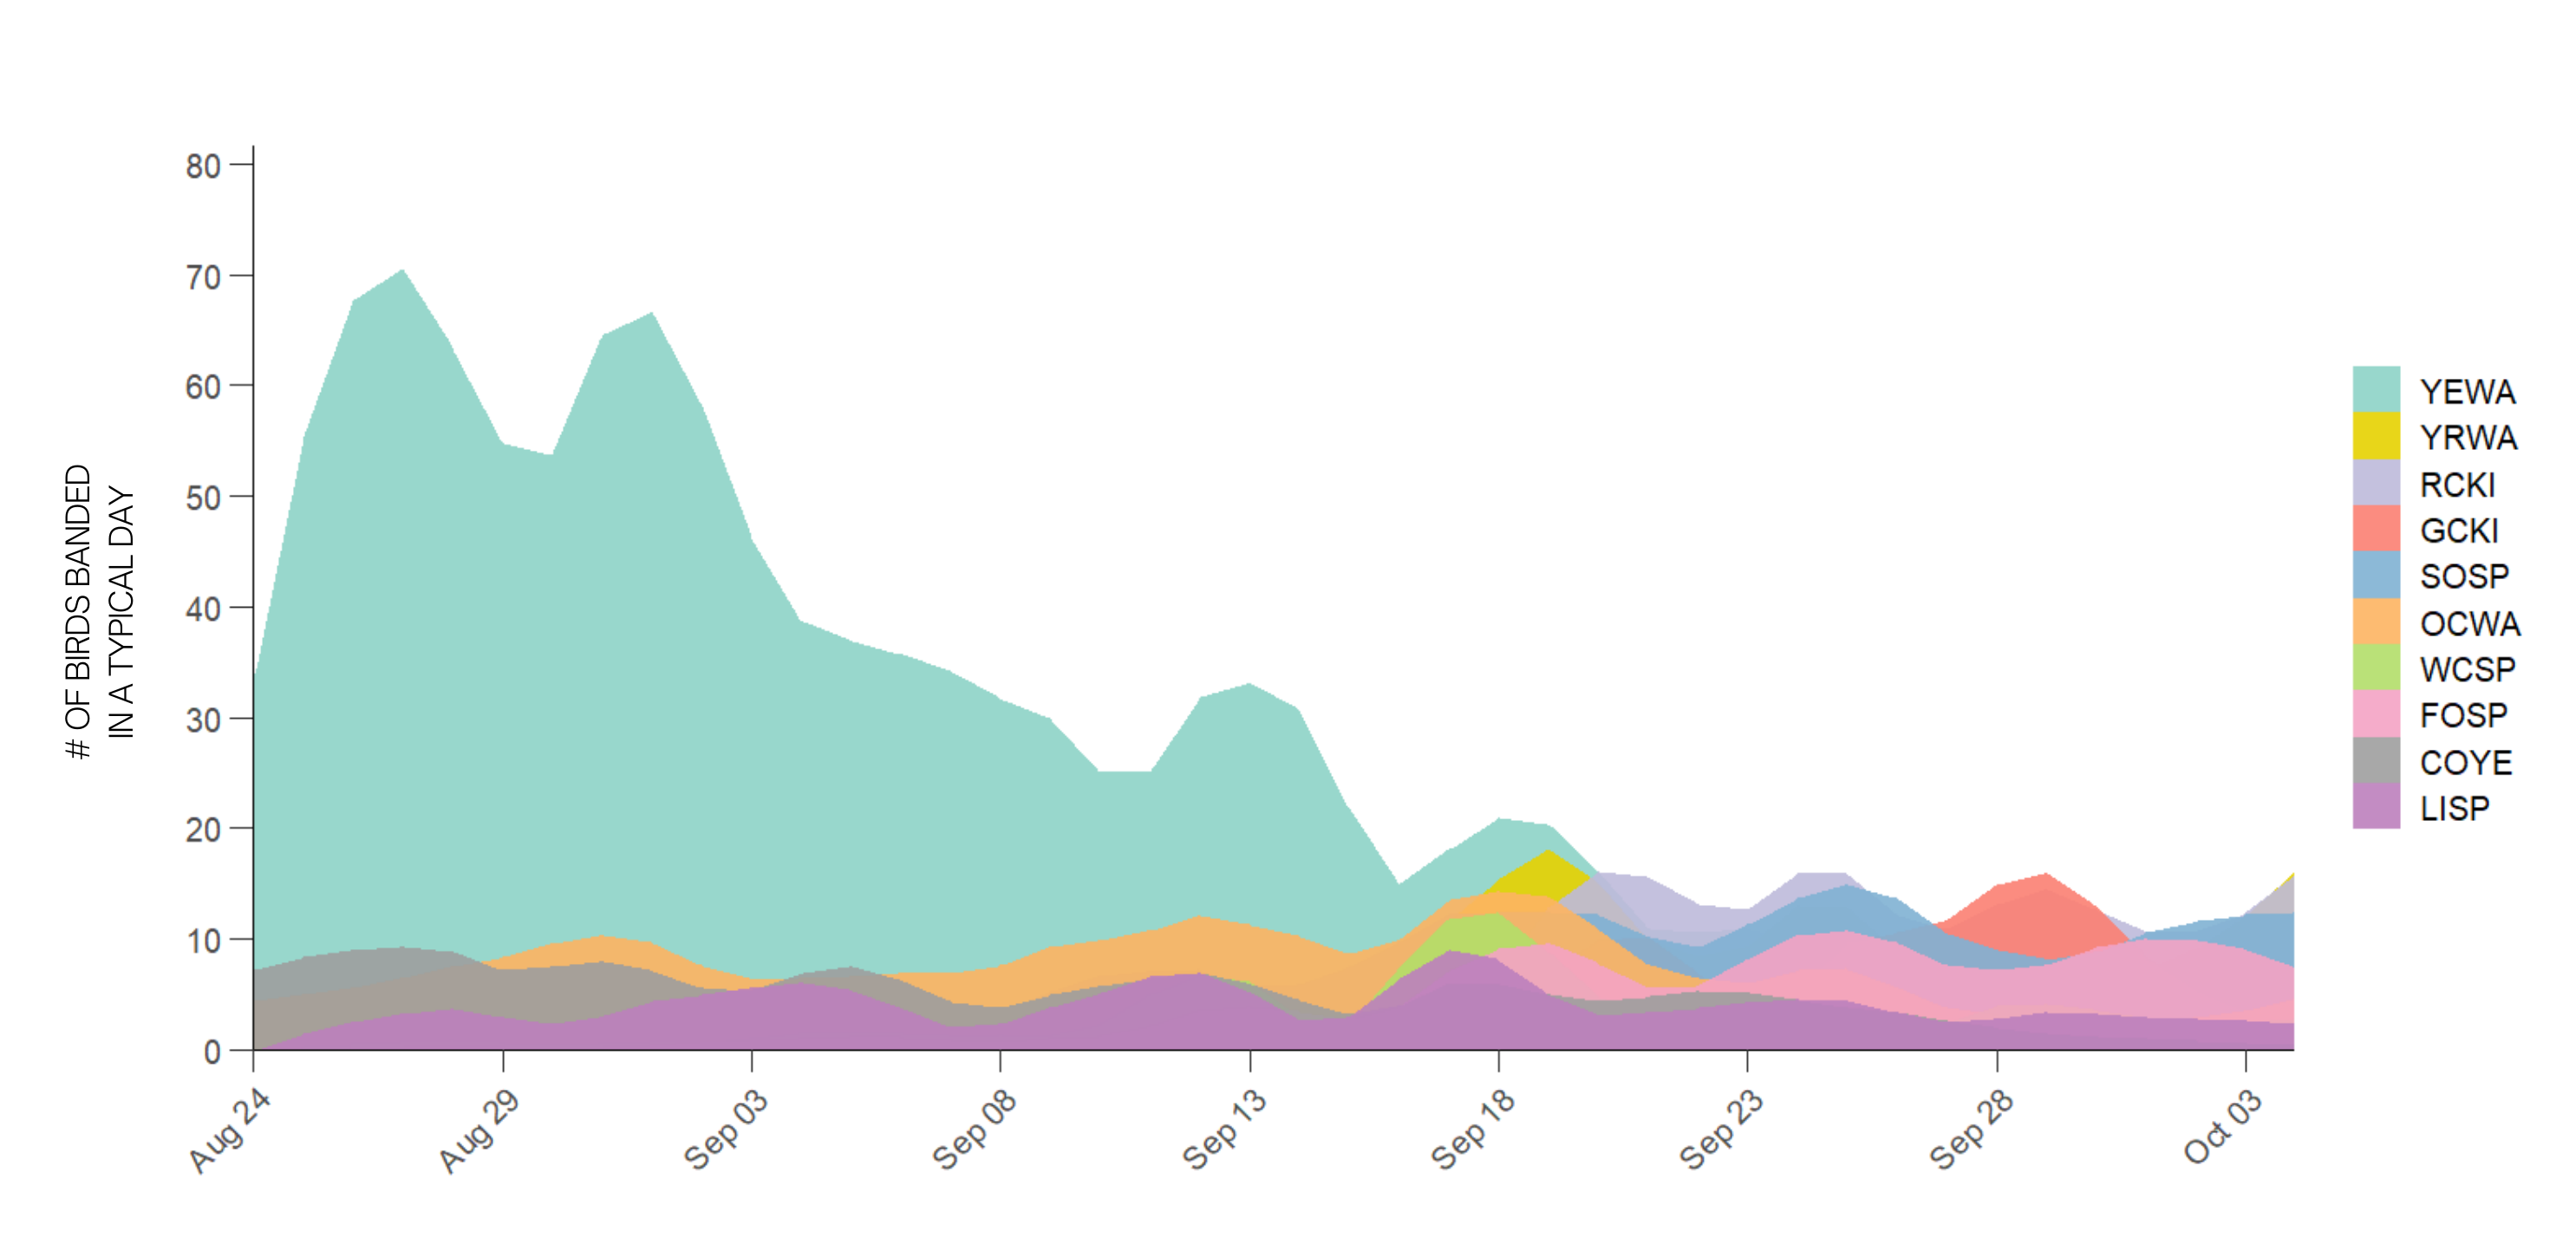
The 10 most frequently banded species at the IIBO are different in the fall than in the spring, with many more sparrows coming through. Extensive literature shows that migration routes and timing can vary between spring and fall seasons. At Iona Island, Yellow Warblers are among the first to depart and extremely abundant, with 4,747 banded over the 2015-2025 fall monitoring seasons.
Fall migration patterns tend to be more spread out and variable. This is likely in part because birds within a species don’t all nest at the same time and the young birds (who are migrating for the first time) don’t necessarily leave with the adults or move at the same pace.
About the data behind the graph
These graphs and summaries are based on data of newly banded birds at the Iona Island Bird Observatory from 2015 through 2025. Recaptures were excluded so each data point reflects a unique individual. Spring monitoring was defined as April 15th to May 31st, and fall as August 24th to October 4th.
Banding data was sourced primarily from submissions to the Bird Banding Office (BBO) under Environment and Climate Change Canada. Data was analyzed and visualized in RStudio 2024.12.1. Species 4-letter codes were standardized to species level (e.g. UWCS, GWCS, and PSWS changed to WCSP) and the top 10 most frequently banded birds identified for each season.
Daily counts of banded birds were standardized by the daily net-hours and scaled to 84 net-hours, representing a banding day with 14 nets open for 6 hours each. Data was then pooled across all years. This approach highlights migration patterns (when individuals arrive and how that builds over time) rather than differences in effort due to bad weather or limited staffing. Curves were smoothed with LOESS (α = 0.22) to reduce noise and increase public-viewing accessibility. The resulting curves show the typical timing and relative abundance of each species at the station, rather than exact counts from a given single day or year.
Written by Paula Gomez Villalba | Jan 2026
Posted: February 24, 2026